Filesystems can get corrupted in containers just as they can in VMs or in physical machines. Lets identify and fix one in a Kubernetes environment.
| Home | Posts | Tags | About |
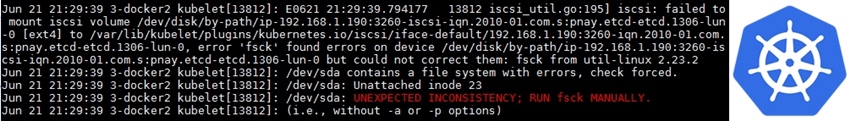
Filesystems can get corrupted in containers just as they can in VMs or in physical machines. Lets identify and fix one in a Kubernetes environment.

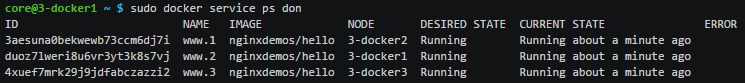
Running stateful apps on Kubernetes or Openshift

How to configure and use the NetApp Docker Volume Plugin (nDVP) with SolidFire storage

A how-to guide for installing the NetApp Docker Volume Plugin (nDVP) on CoreOS
A 3 minute screencast of building container hosts, creating a Docker Swarm on them, starting and scaling a containerized app, introducing failures, and then tearing it all down
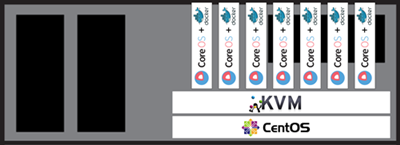
A how-to guide for building a container lab using CentOS 7, KVM, and CoreOS.

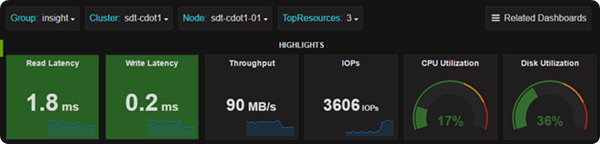
This year at NetApp Insight I’ll be presenting three sessions and want to pack the house so please join me! 62051-2 - Open Source Monitoring Using Harvest, Graphite and Grafana This one is brand new, and I’ll cover the solution, custom counter collection templates and more. So if interested in Harvest/Graphite/Grafana don’t miss it! Schedule it: [Las Vegas, Berlin] 59851-2 - Monitoring Performance Using NetApp OnCommand Performance Manager and API Extensions I’m lending a hand to Dhiman (primary presenter) because I’ve delved into the APIs a bit with Harvest and can share my experiences.
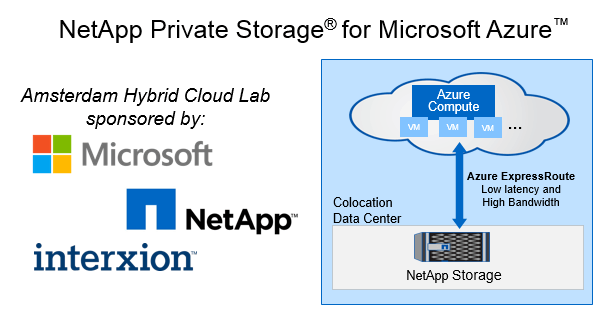
Not too long ago NetApp, Microsoft, and Interxion came together to sponsor a hybrid cloud lab with NetApp Private storage for Azure nearby my office in Amsterdam. When someone was needed to set this up I jumped at the chance! For those unaware of the solution, the basic premise is to use the Hyperscaler providers for elastic compute while maintaining ownership of the data and gaining the rich data management features of NetApp.