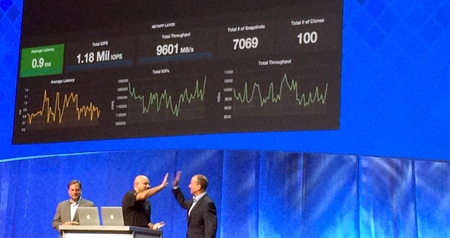
I just got back from NetApp Insight 2015 in Berlin and what a time it was! One highlight for me was seeing the power of NetApp Clustered Data ONTAP scaling a database workload from 22k IOPs on a Hybrid array all the way up to 1.2 Million IOPs on an all flash one with no disruption, while at the same time maintaining hundreds of snapshots and clones. Wow. What other storage system on the planet can do that?
| Home | Posts | Tags | About |