I’m pleased to announce that NetApp Harvest is now posted to the NetApp ToolChest! NetApp Harvest is a data collector that fetches a wide set of performance metrics from NetApp cDOT and 7-mode storage systems, and capacity info from Unified Manager 6+, and posts it to an open-source Graphite metrics server. It also imports 19 dashboards containing over 500 graphs into Grafana to make viewing it all a snap.
I am just thrilled with the results and I hope you are too. Rather than try to explain it in words I created a 10 minute video that gives a quick tour and some steps to get you started:
Want it? Great! All is available without any cost or license key so get to it!
Here are the steps from the video:
Install Graphite and Grafana
Install NetApp Harvest
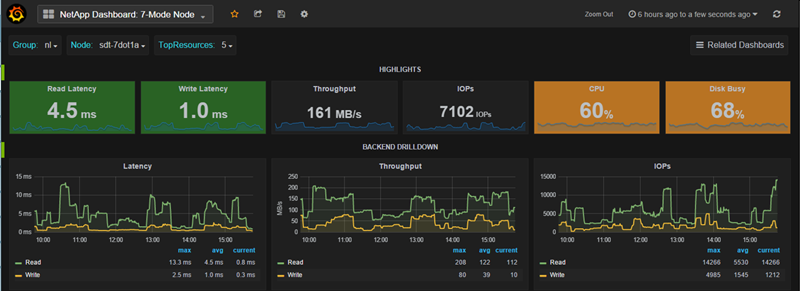
Enjoy your Dashboards and share!
- Questions, Experiences, Tips, or your custom dashboards visit the NetApp Communites section OnCommand Storage Management Software Discussions and tag your post with “netapp-harvest”
This won’t be the last post about NetApp Harvest, Graphite, and Grafana, so stay tuned and let the metrics fun begin!
Comments are always welcome!