I got an email from a colleague asking if I had any ideas for a customer need of presenting CPU busy across a set of systems. He wanted both average and percentile values over a specified timeframe. In his case it was NetApp cDOT storage array nodes, but the concept could be applied to whatever group of systems you happen to be interested in.
I hadn’t yet used the repeat function added in Grafana 2.1 and since I was interested in a single metric across many systems it seemed a natural fit. I used the panel repeat function based on the node template item. So for every node you get a panel.
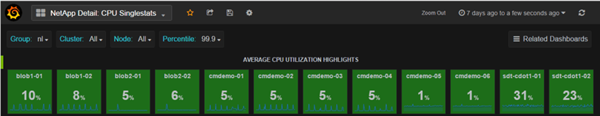
And here’s the result across all my lab nodes with singlestat:

And then the drilldown (on a subset for the screenshot) with graph panels:

So with this I’ve got a dynamic dashboard for at a glance singlestat panels and more detailed graph panels to drilldown if needed. Nice!
If you use NetApp Harvest grab this dashboard and give it a try: db_netapp-detail-cpu-singlestats. After downloading and unpacking, import the json to Grafana (import on the dashboard list) and you should be all set. Or, use that as your starting point and customize further!
Comments are always welcome!